Project Oak Public Meeting Presentation Analysis
What follows is the result of a discussion with ChatGPT (ironic, I know) about the slides presented at the Project Oak public meeting presentation on 5/18/2026.
Overview
This document analyzes a series of public presentation boards displayed during a community meeting regarding the proposed “Project Oak” data center development in Coweta County, Georgia.
The goal of this analysis is not to advocate either for or against the project, but to:
- Separate factual claims from persuasive framing
- Identify what information is emphasized versus omitted
- Examine how the presentation attempts to address community concerns
- Highlight the broader planning and infrastructure implications suggested by the materials
The presentation itself appears highly polished and strategically structured. Across all slides, the messaging consistently focuses on:
- Long-term infrastructure legitimacy
- Regulatory compliance
- Environmental reassurance
- Community compatibility
- Economic upside
- Visual buffering and concealment
At the same time, several major infrastructure details remain largely absent from the boards themselves, including:
- Total campus megawatt demand
- Operator identity
- Tax incentive specifics
- Generator counts
- Traffic volumes
- Construction phasing timelines
- Regional grid implications
- Long-term expansion scenarios
The analysis below reviews each slide individually.
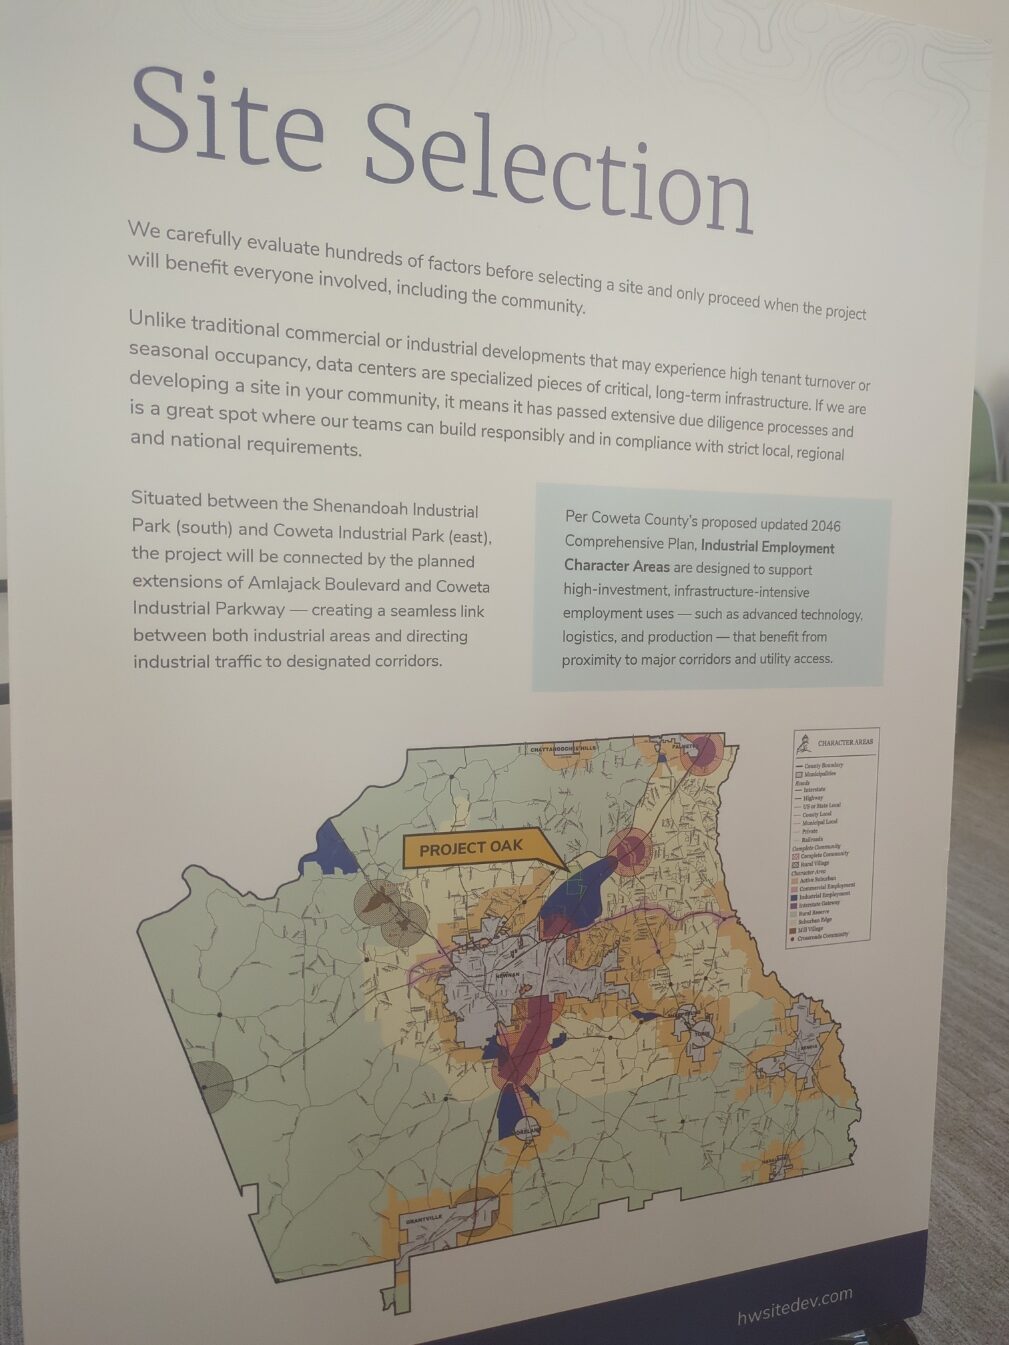
Slide 1 — Site Selection
Core Message
The presentation begins by attempting to establish legitimacy.
The central argument is:
“This project belongs here because the county’s long-term planning framework already envisioned infrastructure-intensive development in this corridor.”
The slide repeatedly references:
- “critical, long-term infrastructure”
- “responsibly”
- “strict local, regional and national requirements”
- the county’s “2046 Comprehensive Plan”
- “Industrial Employment Character Areas”
The project is framed as:
- An inevitable part of modernization
- Compatible with existing planning policy
- Economically beneficial
- Positioned within designated industrial corridors rather than isolated rural land
Key Observations
The “2046 Comprehensive Plan” Reference
This is the most important part of the slide.
The developers are effectively arguing:
“The county already planned for infrastructure-intensive uses in this area.”
That does not automatically settle the debate, however.
A comprehensive plan is:
- A planning and policy document
- A growth-direction framework
- Not necessarily automatic approval for any specific development
Opponents may still argue that:
- “Industrial Employment” does not automatically imply hyperscale data center development
- The scale and implications of modern data infrastructure may exceed what residents envisioned when these planning categories were established
Transportation Corridor Framing
The slide references:
- Amlajack Boulevard extensions
- Coweta Industrial Parkway
- connections between industrial parks
This is intended to reassure residents that:
- Industrial traffic will remain concentrated within designated corridors
- Residential streets will not become primary access routes
However, much of this language references “planned” infrastructure rather than existing completed infrastructure.
What the Slide Does Not Discuss
The board contains no meaningful quantitative detail regarding:
- Electrical demand
- Water demand
- Generator infrastructure
- Tax incentives
- Traffic volumes
- Long-term expansion
The presentation begins by establishing legitimacy before revealing actual scale.
Slide 2 — What Is a Data Center?
Core Message
This slide attempts to normalize the concept of a data center and reduce fear.
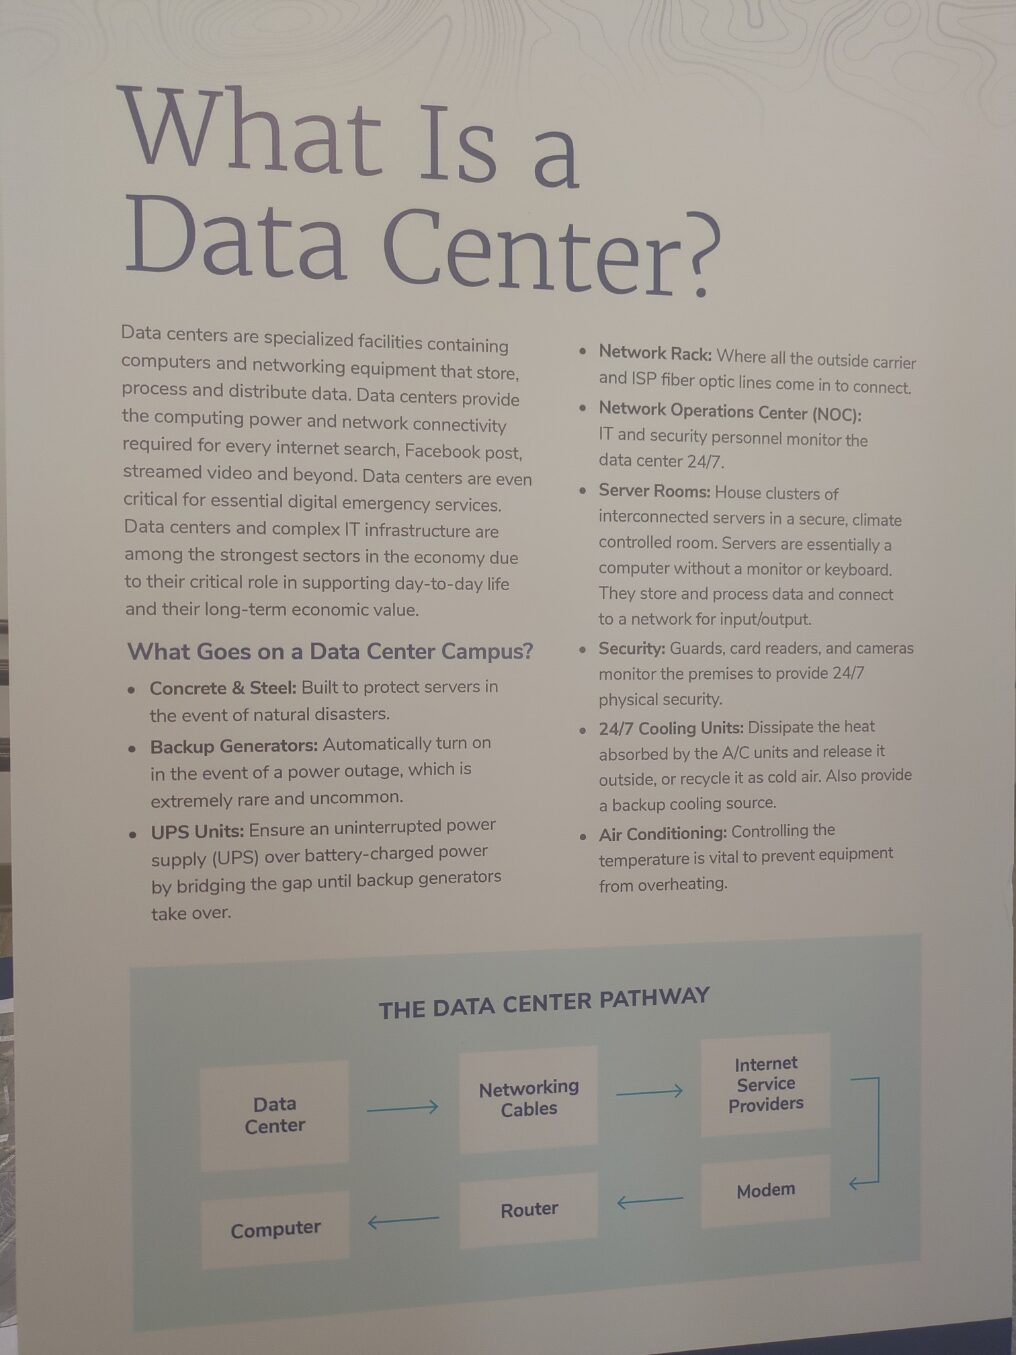
The presentation frames data centers as:
- Essential modern infrastructure
- Quiet and professional environments
- Critical to daily life
- Economically valuable
- Operationally stable
The emotional goal is:
“This is not a dangerous industrial operation. This is where the internet lives.”
Key Observations
Infrastructure Framing
The slide repeatedly connects data centers to:
- Internet searches
- Social media
- Streaming services
- Emergency services
This positioning attempts to move the project psychologically closer to:
- Utilities
- Public infrastructure
- Essential services
rather than traditional industrial development.
Backup Generators
The presentation states:
“Backup generators automatically turn on in the event of a power outage, which is extremely rare and uncommon.”
This wording is carefully constructed.
The slide does not discuss:
- Generator counts
- Fuel storage
- Testing schedules
- Noise during testing
- Emissions
The board focuses on outages while avoiding discussion of routine operational testing.
Cooling Systems
The cooling discussion emphasizes:
- Quiet operations
- Efficiency
- Climate control
However, cooling infrastructure is often one of the largest:
- Power consumers
- Noise sources
- Potential water users
within a data center campus.
These complexities are largely omitted.
Simplified Technical Diagram
The “Data Center Pathway” graphic is intentionally simplistic.
Its purpose is not technical precision.
Its purpose is familiarity.
The audience is encouraged to think:
“This is just part of how the internet works.”
rather than focusing on the scale of the infrastructure.
Slide 3 — Noise Levels
Core Message
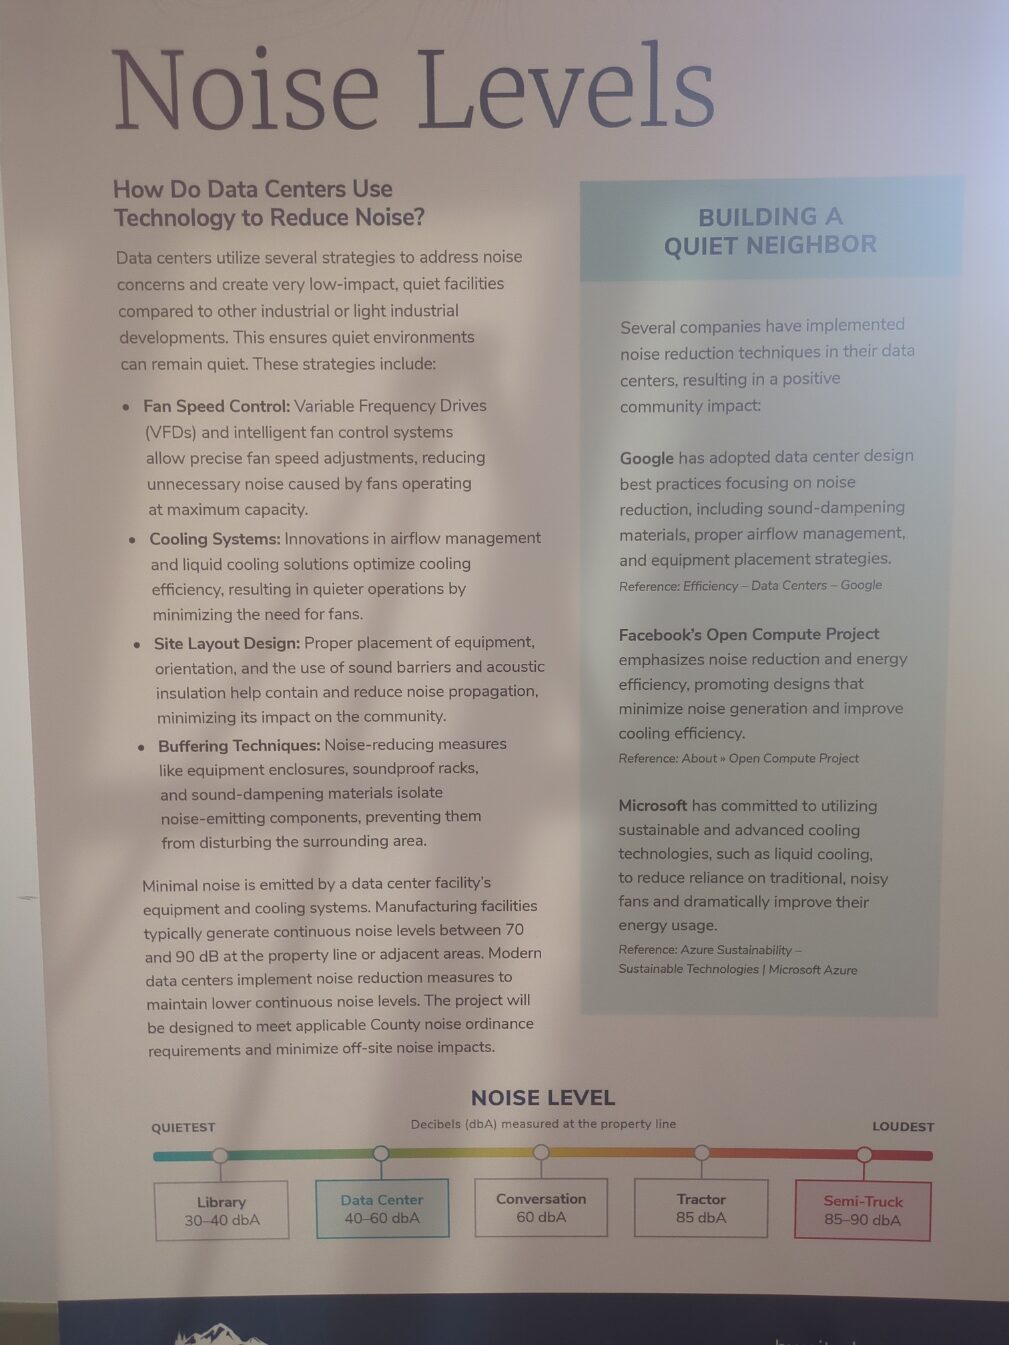
This slide directly addresses one of the most common concerns associated with modern data centers: continuous operational noise.
The presentation argues:
“Modern data centers are quiet, engineered facilities that comply with noise regulations and minimize community impact.”
Key Observations
Important Wording
The most important sentence on the slide is:
“The project will be designed to meet applicable County noise ordinance requirements.”
This is legally careful wording.
It does not claim:
- No disturbance
- No perceptible noise
- No operational sound
Instead it claims compliance.
The 40–60 dBA Comparison
The slide compares data center noise to:
- Libraries
- Conversation
- Tractors
- Semi-trucks
This comparison is designed to frame data centers as:
- Closer to ordinary ambient sound
- Far quieter than heavy industry
However, the slide does not address an important nuance:
A constant 24/7 mechanical hum can be perceived very differently than intermittent human conversation.
Humans respond differently to:
- Tonal noise
- Low-frequency vibration
- Continuous nighttime sound
These issues are not discussed.
Property-Line Measurements
The chart references:
“Decibels measured at the property line.”
Important missing context includes:
- Which property line
- Daytime vs nighttime measurements
- Average vs peak levels
- Weather and terrain effects
- Generator testing conditions
Appeals to Authority
The slide references:
- Facebook/Open Compute
- Microsoft
This is intended to create confidence through association with major technology firms.
However, the slide cites design philosophies rather than measured acoustic outcomes from comparable nearby communities.
Slide 4 — Environment: Light, Odors & Stormwater
Core Message
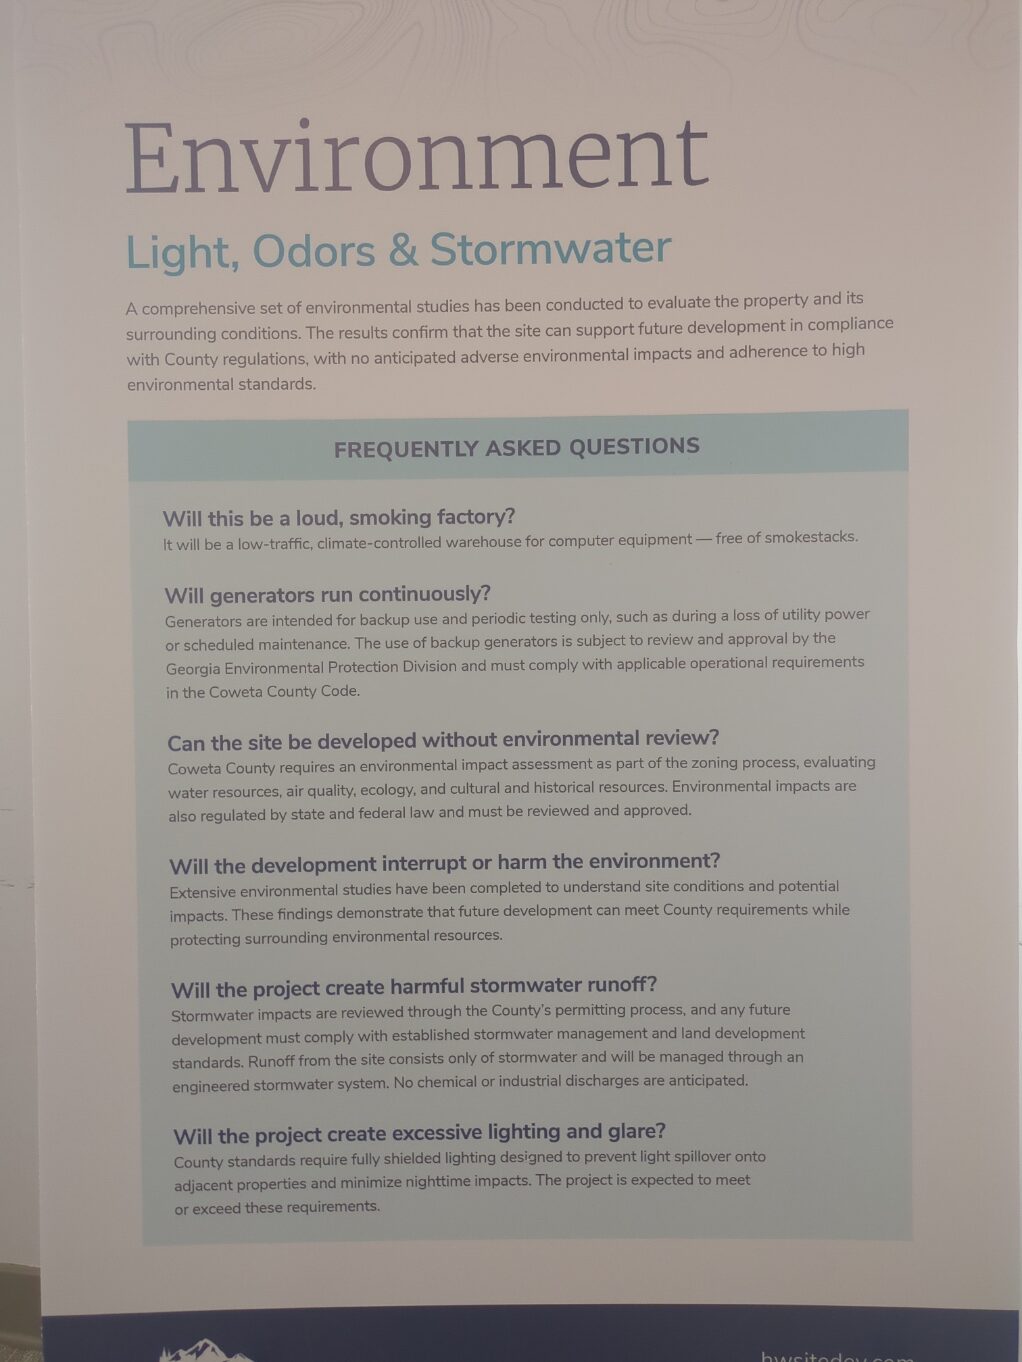
This slide focuses on environmental reassurance.
The central message is:
“This project is regulated, studied, and environmentally manageable.”
Key Observations
FAQ Structure
The FAQ format itself is revealing.
It suggests the developers are responding directly to concerns already circulating publicly.
The questions focus on:
- Factories
- Generators
- Environmental review
- Stormwater runoff
- Lighting and glare
“Loud, Smoking Factory” Framing
The first question asks:
“Will this be a loud, smoking factory?”
This is strategically phrased.
It allows the presentation to rebut an exaggerated image rather than addressing more nuanced concerns about:
- Infrastructure intensity
- Land-use transformation
- Utility burden
- Long-term corridor evolution
Environmental Impact Language
The slide states:
“No anticipated adverse environmental impacts.”
This does not mean “zero impact.”
In regulatory language, it more commonly means:
- Impacts are expected to remain within allowable thresholds
- Mitigation measures are considered sufficient
Stormwater Discussion
The presentation emphasizes:
- Engineered stormwater systems
- Lack of industrial discharge
- Compliance with county standards
However, it avoids discussion of:
- Runoff volume changes
- Watershed impacts
- Impervious surface expansion
- Flooding risk
Lighting
The slide promises:
- Shielded lighting
- Reduced spillover
- Compliance with standards
This is likely intended to reassure nearby residents concerned about:
- Nighttime brightness
- Security lighting
- Loss of rural character
Slide 5 — Utilities: Power
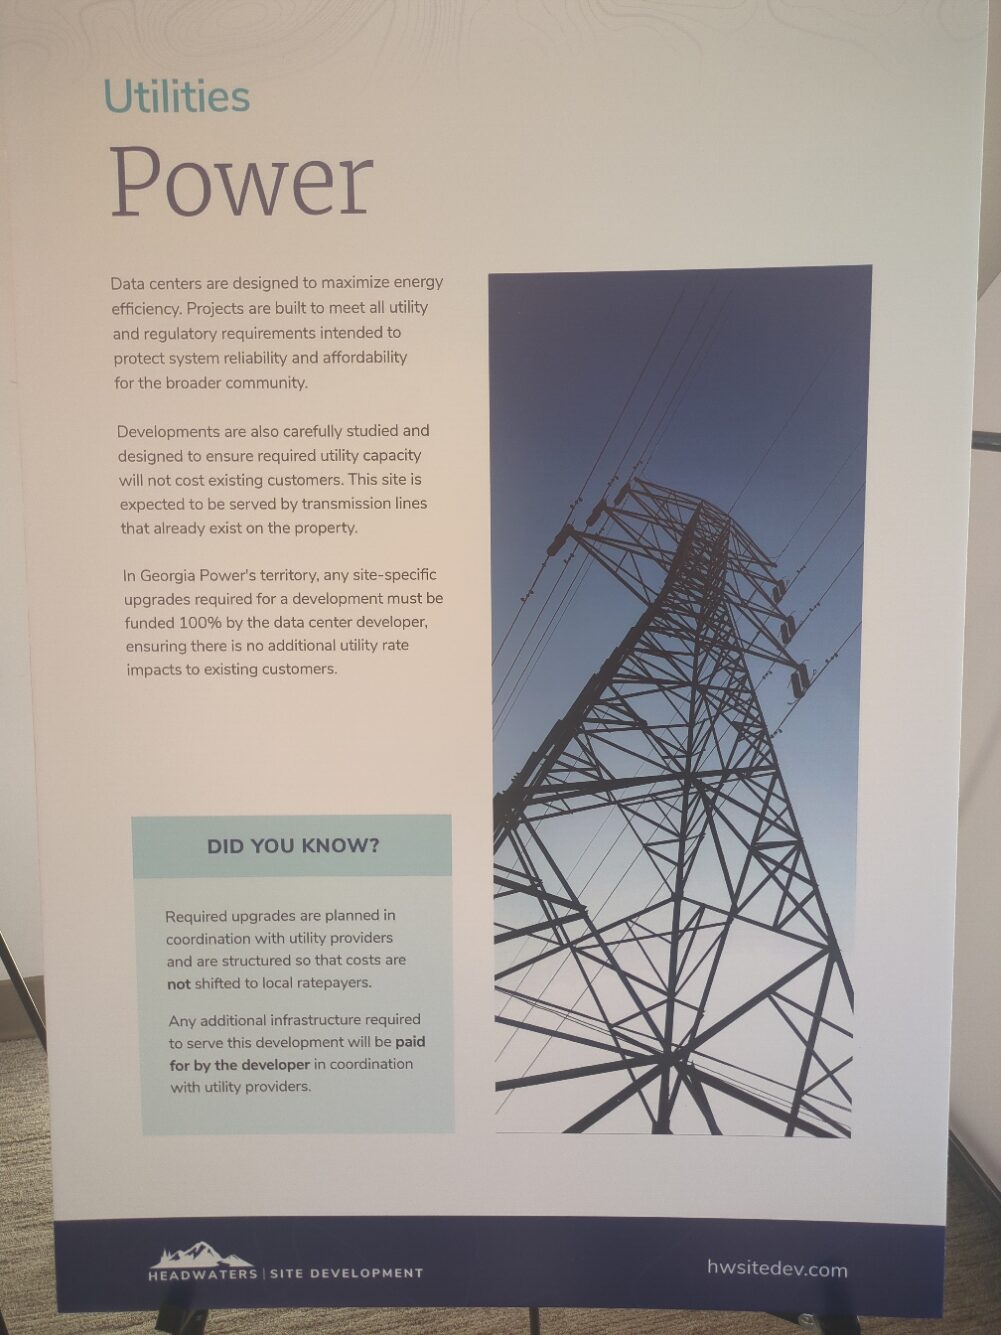
Core Message
This slide is strategically important because power demand is one of the defining characteristics of modern hyperscale data centers.
The central argument is:
“This project will not burden existing utility customers.”
Key Observations
Existing Transmission Infrastructure
The slide states:
“This site is expected to be served by transmission lines that already exist on the property.”
This strongly suggests transmission access was a major factor in site selection.
Modern data centers increasingly locate near:
- High-voltage corridors
- Existing substations
- Utility capacity
“Developer Pays” Framing
The slide repeatedly emphasizes:
- Developer-funded upgrades
- No utility rate impact
- Coordination with utility providers
This is intended to counter fears that:
- Residents will subsidize infrastructure expansion
- Local utility rates will increase because of the project
Important Omission: Megawatt Demand
Despite focusing entirely on power infrastructure, the slide never reveals:
- Total megawatt demand
- Peak demand
- Equivalent residential load
- Expansion capacity
This omission becomes increasingly noticeable.
The Broader Question
The slide narrowly addresses:
“Who pays for direct infrastructure upgrades?”
It does not address:
- Regional grid planning
- Future generation expansion
- Long-term transmission implications
- Cumulative corridor growth
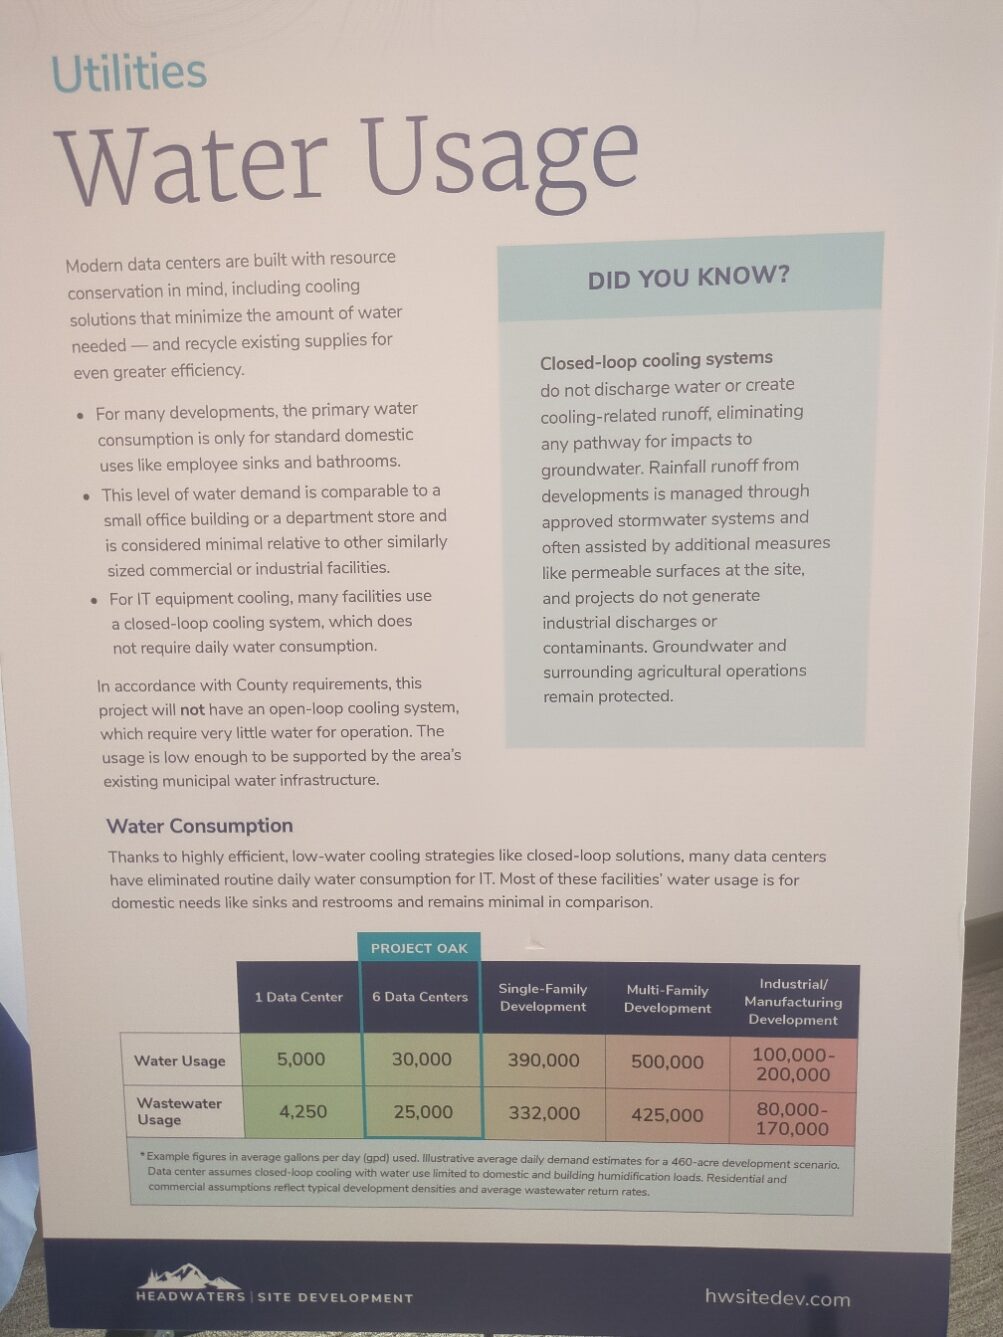
Slide 6 — Utilities: Water Usage
Core Message
This slide attempts to counter one of the largest emerging national criticisms of data center development: water consumption.
The argument is:
“This project uses surprisingly little water compared to other forms of development.”
Key Observations
Closed-Loop Cooling
The most important technical statement is:
“This project will not have an open-loop cooling system.”
Closed-loop systems generally:
- Recycle water
- Reduce continuous consumption
- Require far less daily makeup water than evaporative-heavy systems
This is a meaningful distinction.
Comparison Against Housing
The slide compares:
- 6 data centers = 30,000 gallons/day
against:
- Single-family development = 390,000 gallons/day
- Multifamily development = 500,000 gallons/day
This comparison is strategically powerful because it reframes the discussion:
“This may use less water than alternative growth patterns.”
Important Assumption
The comparison relies heavily on a footnote assumption:
Closed-loop cooling with water use limited primarily to domestic and humidification loads.
If cooling strategies change in the future, water demand could also change.
Groundwater Protection
The slide repeatedly references:
- Groundwater protection
- Agricultural compatibility
- No industrial discharge
This suggests nearby agricultural and rural concerns were already anticipated.
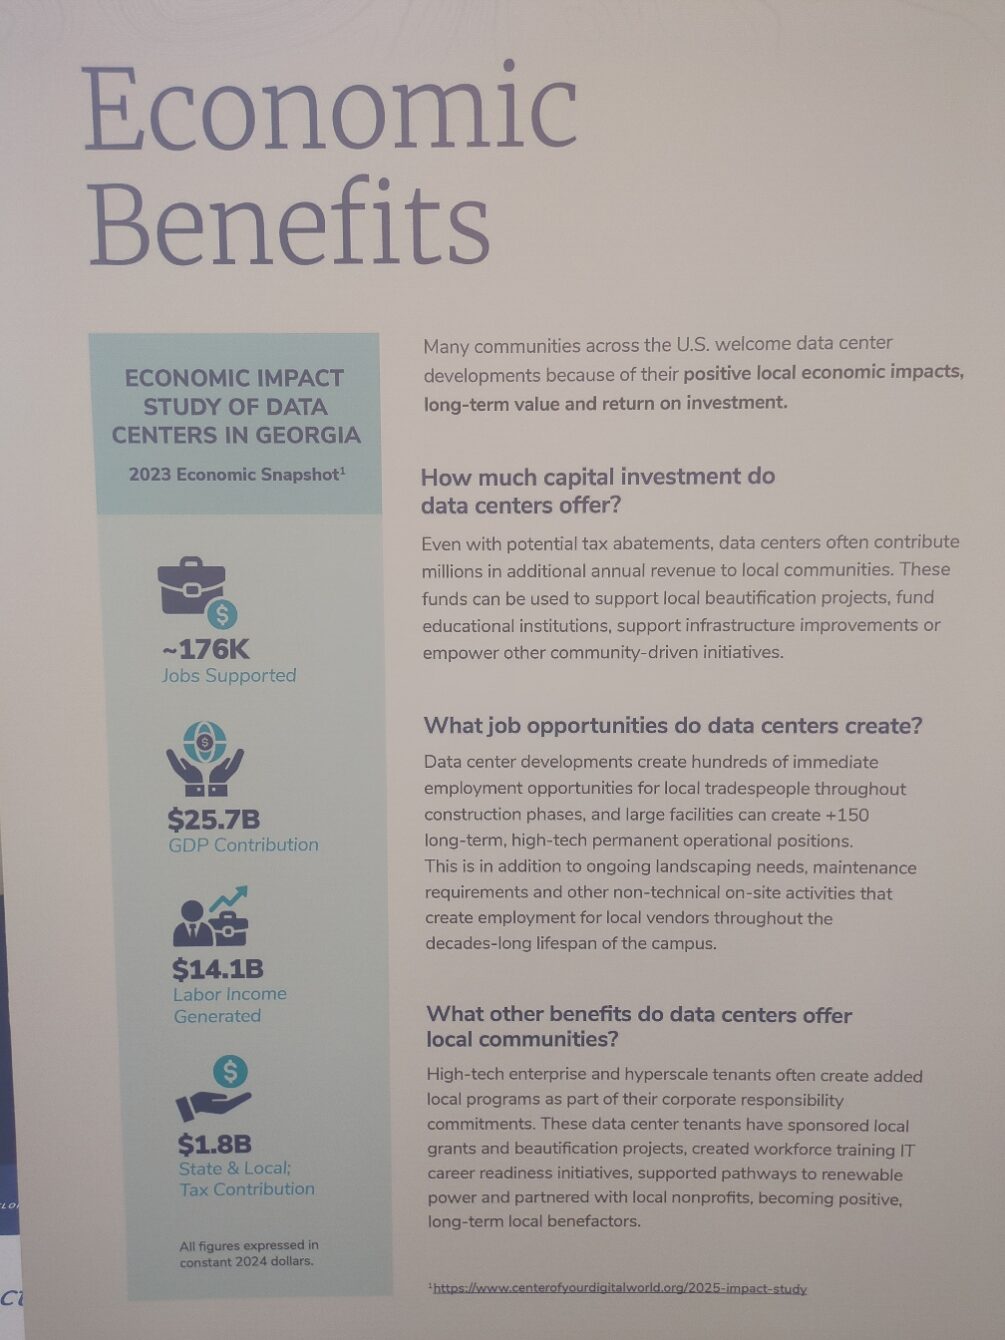
Slide 7 — Economic Benefits
Core Message
This slide provides the primary justification for why the community should want the project.
The argument is:
“The economic upside outweighs the concerns.”
Key Observations
Broad Statewide Statistics
The slide cites statewide Georgia data center statistics:
- 176K jobs
- $25.7B GDP contribution
- $1.8B tax contribution
These are not project-specific numbers.
The effect is to associate the local proposal with the entire statewide economic ecosystem.
Tax Abatements
The slide includes an important phrase:
“Even with potential tax abatements…”
This strongly suggests incentives or abatements may be part of the project discussion.
However, the presentation provides no details regarding:
- Incentive structures
- Duration
- Tax categories
- Revenue projections
- Assessment impacts
Jobs
The slide discusses:
- Construction jobs
- Operational jobs
- Vendor support activity
It claims:
“Large facilities can create +150 long-term positions.”
However, it does not specify:
- Whether this project specifically will create that number
- Local hiring expectations
- Phased employment timing
Community Partnerships
The presentation also emphasizes:
- Grants
- Beautification projects
- Workforce development
- Nonprofit partnerships
This reframes the operator as:
“A long-term civic partner rather than merely a land consumer.”
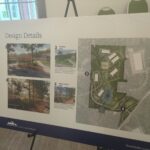
Slides 8–11 — Design Details
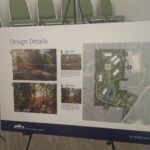
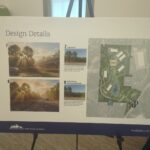
Core Message
These boards shift almost entirely into visual and emotional reassurance.
The central argument becomes:
“You largely will not see the project.”
Key Observations
Visual Buffering Strategy
The renderings repeatedly emphasize:
- Mature canopy
- Topographic variation
- Terrain profiles
- Tree buffers
- Screening
This indicates the developers understand that:
- Community identity
- Rural/suburban character
- Visual change
may be more emotionally important than technical infrastructure details.
Carefully Calibrated Wording
The presentation repeatedly uses phrases such as:
- “Largely obscured”
- “Partially visible”
- “Screened”
- “Buffered”
This is strategically cautious language.
The boards avoid unrealistic promises of total invisibility.
The Substation
One of the most revealing details is the labeled:
“Substation – 10.12 Acres”
This strongly implies substantial long-term electrical demand.
The size of the electrical infrastructure reinforces the scale of the overall campus.
Site Layout
The campus layout suggests:
- Multiple large data halls
- Internal circulation roads
- Stormwater infrastructure
- Phased development potential
- Long-term expansion capability
This is clearly not a small standalone facility.
What the Renderings Avoid
None of the visual simulations depict:
- Nighttime lighting
- Generator operations
- Cooling equipment activity
- Delivery traffic
- Security infrastructure prominence
- Construction phases
The visual environment is consistently:
- Calm
- Green
- Quiet
- Warmly lit
- Sparse in activity
This is deliberate emotional framing.
Overall Presentation Assessment
General Strategy
The presentation follows a highly deliberate progression:
- Legitimacy
- Normalization
- Fear reduction
- Economic justification
- Visual/emotional reassurance
The sequencing is sophisticated and intentional.
What the Presentation Does Well
The materials:
- Anticipate common public concerns
- Present a calm and measured tone
- Avoid overtly aggressive messaging
- Use legally cautious wording
- Provide some meaningful technical reassurance
- Show evidence of real planning and mitigation work
This does not appear to be a casually assembled industrial pitch.
What the Presentation Avoids
The most consequential omissions include:
- Total electrical demand
- Regional grid implications
- Generator scale
- Operator identity
- Traffic studies
- Construction timelines
- Long-term expansion scenarios
- Tax incentive specifics
- AI compute implications
These omissions are notable because they involve some of the largest real-world implications of modern hyperscale infrastructure.
The Underlying Tension
Ultimately, the presentation attempts to reconcile two competing narratives:
Developer Narrative
“This is low-impact, future-oriented infrastructure that strengthens the local economy.”
Community Fear
“This may permanently transform the corridor into major industrial infrastructure territory.”
Importantly, the presentation does not fully disprove the second concern.
Instead, it argues:
- The transformation is planned
- The impacts are mitigated
- The visibility is reduced
- The infrastructure is regulated
- The economic value is worth it
That is a very different argument.
Final Conclusion
The boards should not be viewed as a technical disclosure package.
They are better understood as:
A carefully engineered community acceptance presentation.
The real operational and infrastructure story likely exists in:
- Zoning submissions
- Utility interconnect filings
- Environmental studies
- Traffic analyses
- Tax negotiations
- Utility planning documents
- Construction and phasing plans
rather than within the presentation boards themselves.